32
Thai Economic Indicators 2019
หน้
า
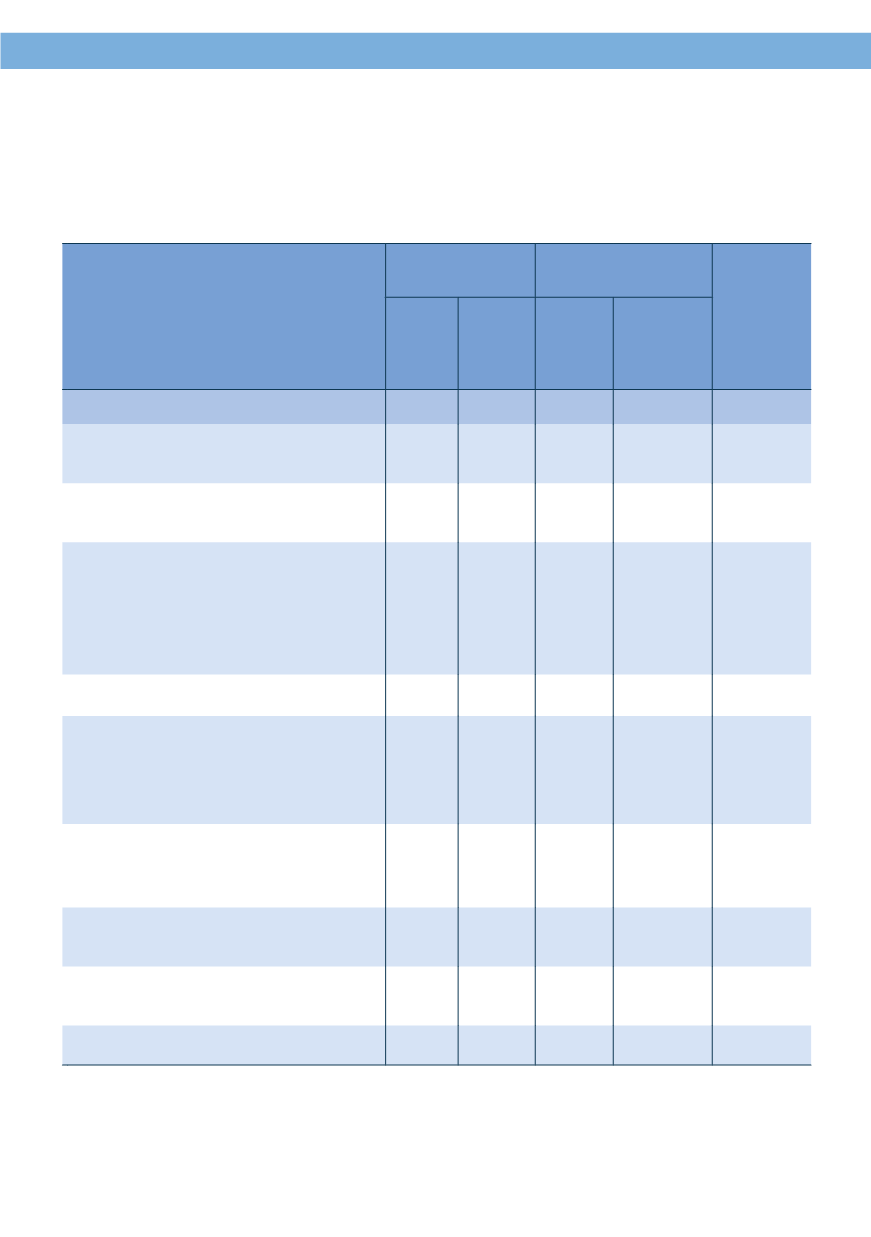
ตาราง 3.2 จำ
านวนสถานประกอบการ คนทำ
างานและมู
ลค่
าผลผลิ
ตของสถานประกอบการ
อุ
ตสาหกรรมการผลิ
ต ปี
ข้
อมู
ลพ.ศ. 2559
Table 3.2 Number of Establisments, Persons Engaged and Value of
Gross Output of Manufacturing Establishments: Data of 2016
หมวดอุ
ตสาหกรรม
Division of Industry
สถานประกอบการ (แห่
ง)
Establisments (Units)
คนทำ
างาน (คน)
Persons Engaged (Persons)
มู
ลค่
าผลผลิ
ต
(ล้
านบาท)
Value of
Gross Output
(Millions Baht)
จำ
านวน
Number
สั
ดส่
วน%
ratio%
จำ
านวน
Number
เฉลี
่
ยต่
อสถาน
ประกอบการ
per
Establisments
รวม Total
443,188 100.0 4,461,443
10
12,884,439
ผลิ
ตภั
ณฑ์
อาหารและเครื่
องดื่
ม Manufacture
of Food Products and Beverages
119,271 26.9 981,500
9
2,358,629
การผลิ
ตเสื้
อผ้
าเครื่
องแต่
งกาย
Manufacture of Wearing Apparels
66,888 15.1 297,014
5
200,721
การผลิ
ตไม้
ผลิ
ตภั
ณฑ์
จากไม้
และไม้
ก๊
อก (ยกเว้
น
เฟอร์
นิ
เจอร์
) สิ่
งของจากฟางและวั
สดุ
ถั
กสานอื่
นๆ
Manufacture of Wood and of Products of
Wood and Cork (Except Furniture)
Manufacture of Articles of Straw and Plaiting
61,117 13.8 190,307
4
118,181
การผลิ
ตสิ่
งทอ Manufacture of Textiles 63,088 14.2 272,612
5
268,553
การผลิ
ตผลิ
ตภั
ณฑ์
โลหะประดิ
ษฐ์
(ยกเว้
น
เครื่
องจั
กรและอุ
ปกรณ์
) Manufacture of
Fabricated Metal Products (Excepts
Machinery and Equipment)
37,223 8.4 345,719
10
627,073
การผลิ
ตผลิ
ตภั
ณฑ์
อื่
นๆ ที่
ทำ
าจากแร่
อโลหะ
Manufacture of other Non-Metallic
Mineral Products
12,205 2.8 198,597
17
477,265
การผลิ
ตเฟอร์
นิ
เจอร์
Manufacture of Furniture
10,569 2.4 106,249
11
111,717
การซ่
อมและการติ
ดตั้
งเครื่
องจั
กรและอุ
ปกรณ์
Repair and Installation of Machinery
7,507 1.7 49,236
7
88,111
การผลิ
ตอื่
น ๆ Others Manufacture
65,320 14.7 2,020,208
31
8,634,189
หมายเหตุ
:
ที่
มา:
Note:
Source:
ข้
อมู
ลจากสำ
ามะโนธุ
รกิ
จและอุ
ตสาหกรรม พ.ศ. 2560 (อุ
ตสาหกรรมการผลิ
ต)
สำ
านั
กงานสถิ
ติ
แห่
งชาติ
กระทรวงดิ
จิ
ทั
ลเพื่
อเศรษฐกิ
จและสั
งคม
Data from The 2017 Business and Industrial Census (Manufacturing Industry)
National Statistical Of ce, Ministry of Digital Economy and Society


