7
แม
จํ
านวนประชากรในประเทศไทยจะ
เพิ่
มขึ้
นทุ
กป
แต
อั
ตราการเพิ
่
มของประชากรกลั
บ
ลดลงอย
างต
อเนื
่
อง ซึ่
งเป
นผลมาจากจํ
านวนการ
เกิ
ดลดลง จากที
่
เคยมี
การเกิ
ดเฉลี
่
ยป
ละล
านคนแต
หลั
งจากมี
นโยบายด
านประชากรเมื
่
อป
2513
จํ
านวนการเกิ
ดได
ลดลงอย
างต
อเนื
่
อง จนใน
ป
จจุ
บั
น (พ.ศ. 2557) จํ
านวนการเกิ
ดมี
ประมาณ
800 , 000 คนต
อป
และข
อมู
ลจากกา รคาด
ประมาณประชากร จํ
านวนประชากรวั
ยเด็
ก (0-14
ป
) มี
แนวโน
มลดลงเรื
่
อยๆ จากร
อยละ 19.8 ในป
2553 เหลื
อเพี
ยงร
อยละ 14.8 และร
อยละ 12.8
ในป
2573 และป
2583 ตามลํ
าดั
บ นั
บเป
นป
จจั
ย
สํ
าคั
ญที
่
นํ
าไปสู
การเปลี
่
ยนแปลงของโครงสร
าง
ประชากร ทั
้
งโครงสร
างเพศ อายุ
และการกระจาย
ตั
วของประชากร ซึ
่
งส
งผลกระทบต
อการพั
ฒนา
ประเทศทั้
งด
านเศรษฐกิ
จ สั
งคม และสิ่
งแวดล
อม
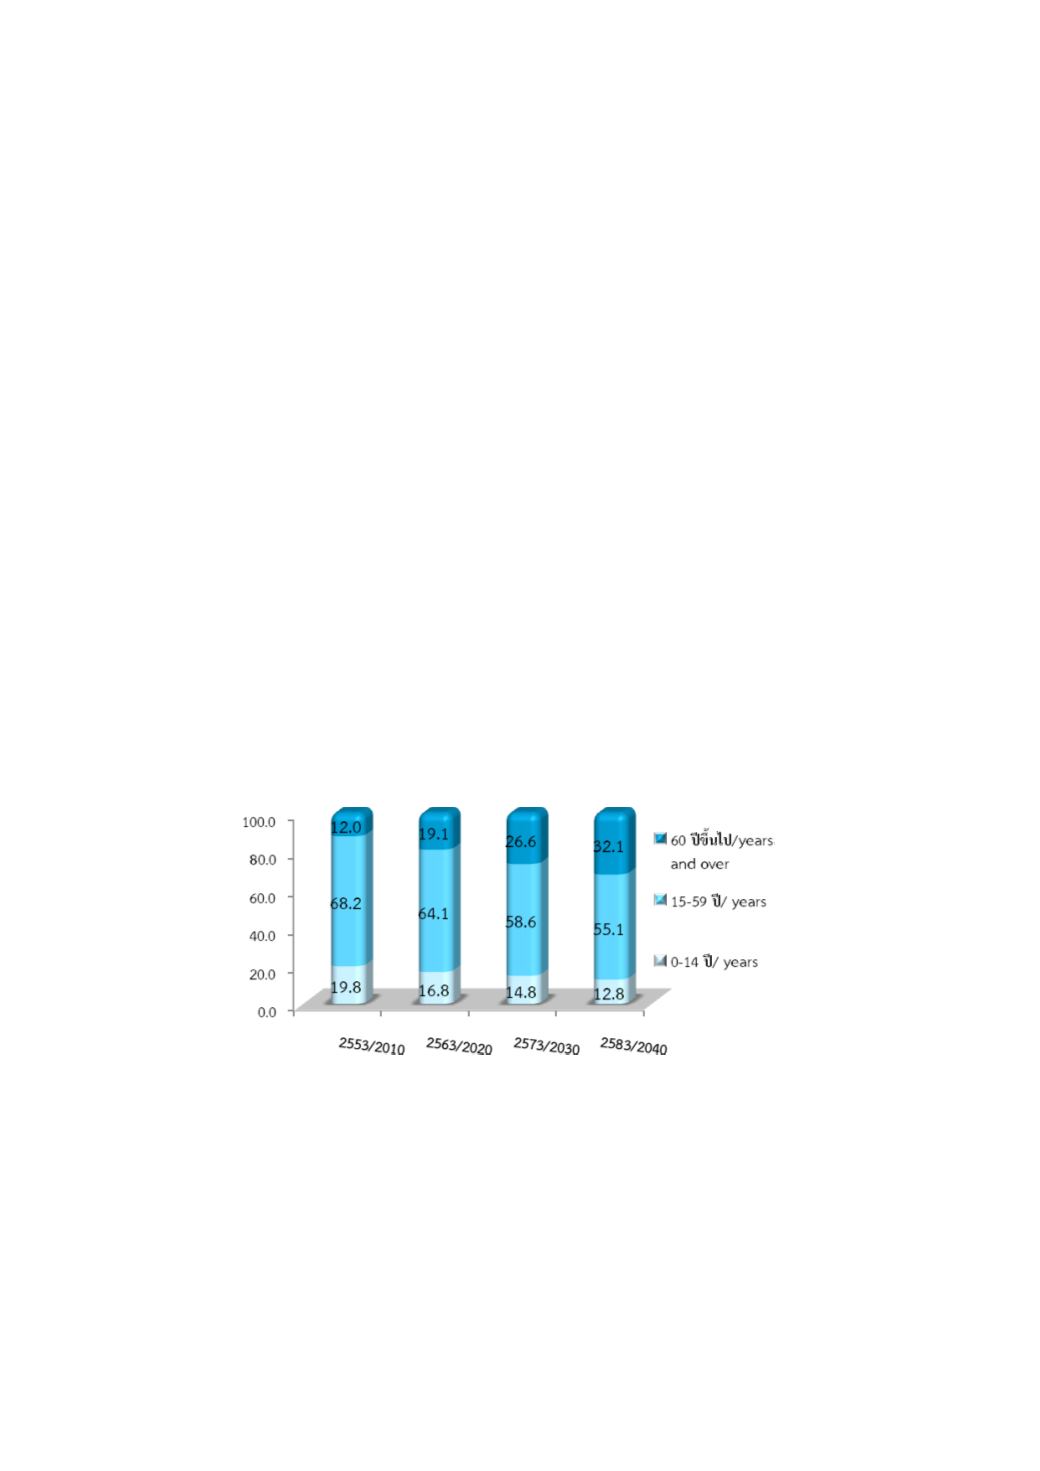
The number of the population
increases every year, however, the growth
rate of population has been declining
continuously since the number of
population at birth declined due to the
effectiveness of family planning program
in 1970. From the population projection,
it was found that the number of children
(0-14 years) decreased from 19.8% in
2010 to 14.8% and 12.8% in 2030 and
2040 respectively, this is a key factor led
to the change of population age, sex
structure and population distribution
which would affect to economic, social
and environment.
ร
อยละ/Percentage
แผนภู
มิ
1.2 ประชากร จํ
าแนกตามกลุ
มอายุ
พ.ศ. 2553-2583
Chart 1.2 Population by Age Group: 2010-2040
ที่
มา:
สํ
ามะโนประชากรและเคหะ พ.ศ. 2553 สํ
านั
กงานสถิ
ติ
แห
งชาติ
การคาดประมาณประชากรของประเทศไทย พ.ศ. 2553-2583 สํ
านั
กงานคณะกรรมการพั
ฒนาการเศรษฐกิ
จและสั
งคมแห
งชาติ
Source: Population and Housing Census: 1960-2010, National Statistical Office.
Population Projection for Thailand: 2010-2040, Office of the National Economic and Social Development Board.
ป
/Year


