11
นอกจากข
อมู
ลที
่
แสดงให
เห็
นถึ
งการ
เพิ
่
มขึ
้
นของการรั
บภาระในการเลี้
ยงดู
ผู
สู
งอายุ
แล
ว ยั
งมี
อี
กตั
วชี
้
วั
ดหนึ
่
งที
่
แสดงให
เห็
นถึ
งจํ
านวน
ประชากรวั
ยแรงงานที
่
เกื
้
อหนุ
นผู
สู
งอายุ
1 คน
คื
อ
“อั
ต ร า ศั
ก ย ภ า พ ส นั
บ ส นุ
น ผู
สู
ง อ า ยุ
(Potential Support Ratio)
” ซึ
่
งคาดว
า
ในอนาคตจํ
านวนผู
ที
่
อยู
ในวั
ยทํ
างานที
่
เกื
้
อหนุ
น
ผู
สู
งอายุ
1 คน ลดน
อยลงมาก จาก 5 คน ในป
2557 เหลื
อเพี
ยง 2 คน ในอี
ก 20 ป
ข
างหน
า
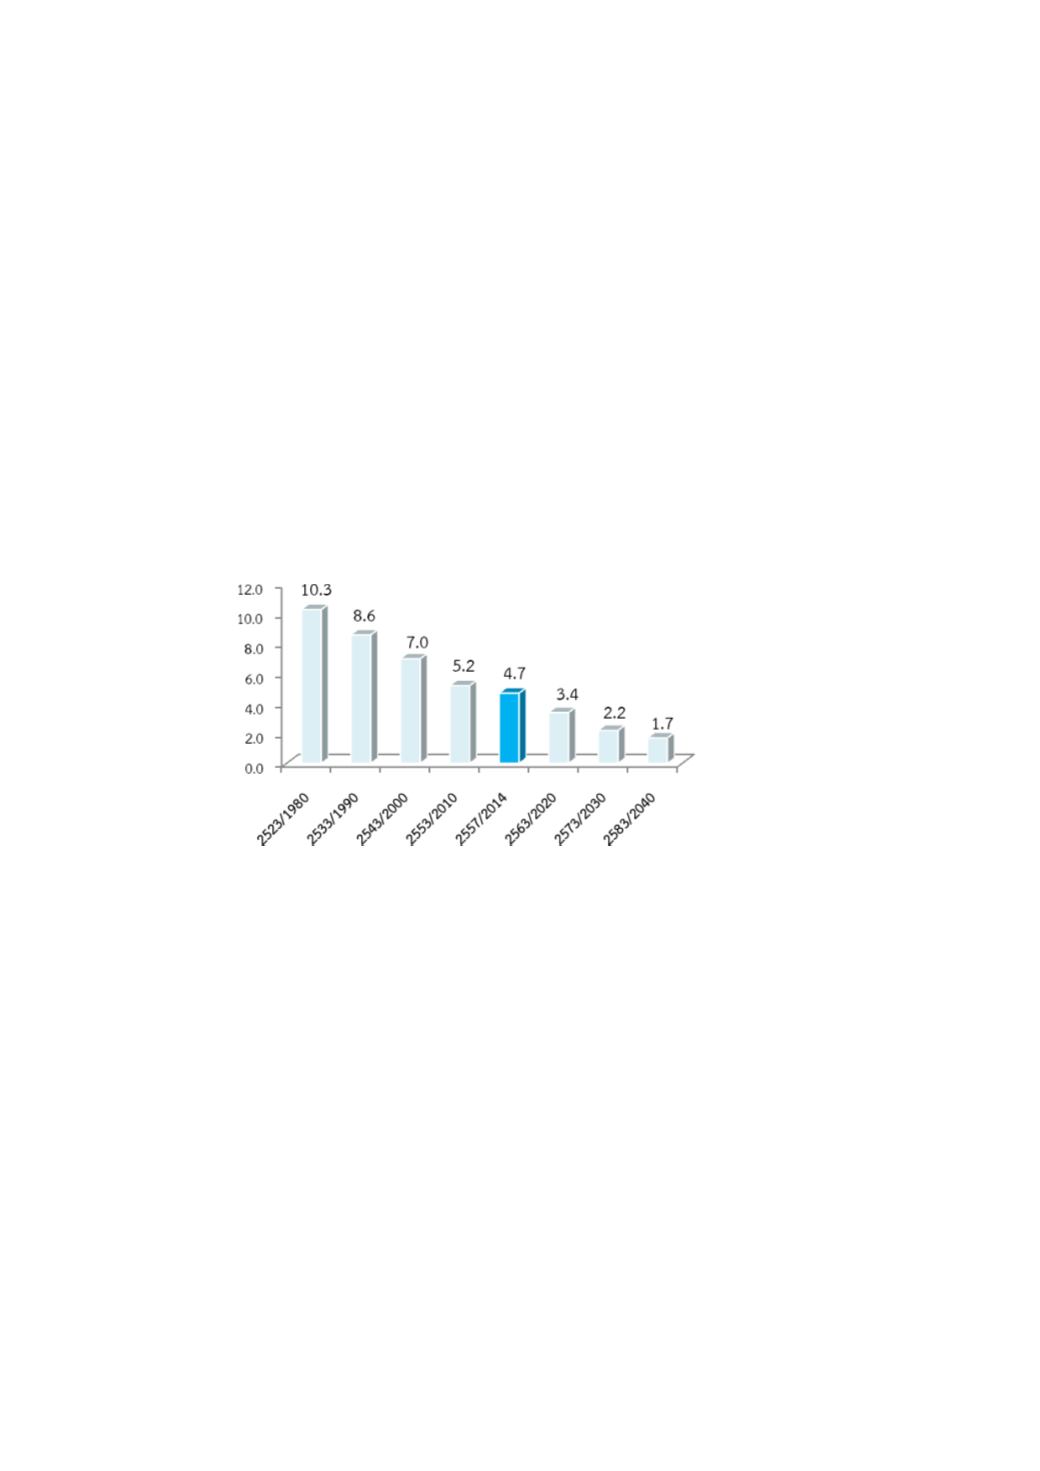
Potential Support Ratio which is,
another major indicator presenting the
measurement the ability of working aged
group in supporting 1 older person,
showed a decline from 5 persons in 2014
to 2 persons for the next 20 years.
ที่
มา:
สํ
ามะโนประชากรและเคหะ พ.ศ. 2523-2553 สํ
านั
กงานสถิ
ติ
แห
งชาติ
ข
อมู
ล พ.ศ. 2557 คํ
านวณโดยสํ
านั
กงานสถิ
ติ
แห
งชาติ
จากข
อมู
ลทะเบี
ยน กรมการปกครอง
การคาดประมาณประชากรของประเทศไทย พ.ศ. 2553-2583 สํ
านั
กงานคณะกรรมการพั
ฒนาการเศรษฐกิ
จและสั
งคมแห
งชาติ
Source: Population and Housing Census: 1980-2010, National Statistical Office.
Data in 2014 was calculated by National Statistical Office, From Registration and Administration bases of
Department of Provincial Administration.
Population Projections for Thailand: 2010-2040, Office of the National Economic and Social Development Board.
อั
ตรา/Rate
ป
/year
แผนภู
มิ
1.4 อั
ตราศั
กยภาพสนั
บสนุ
นผู
สู
งอายุ
พ.ศ. 2523-2583
Chart 1.4 Potential Support Ratio: 1980-2040


