38
ตั
วชี
้
วั
ดที
่
สํ
าคั
ญอี
กตั
วหนึ
่
ง คื
อ อั
ตราการ
อ
านออกเขี
ยนได
พบว
า เพิ่
มขึ้
นมาก เห็
นได
จาก
ข
อมู
ลสํ
ามะโนประชากรและเคหะ พ.ศ. 2503-2553
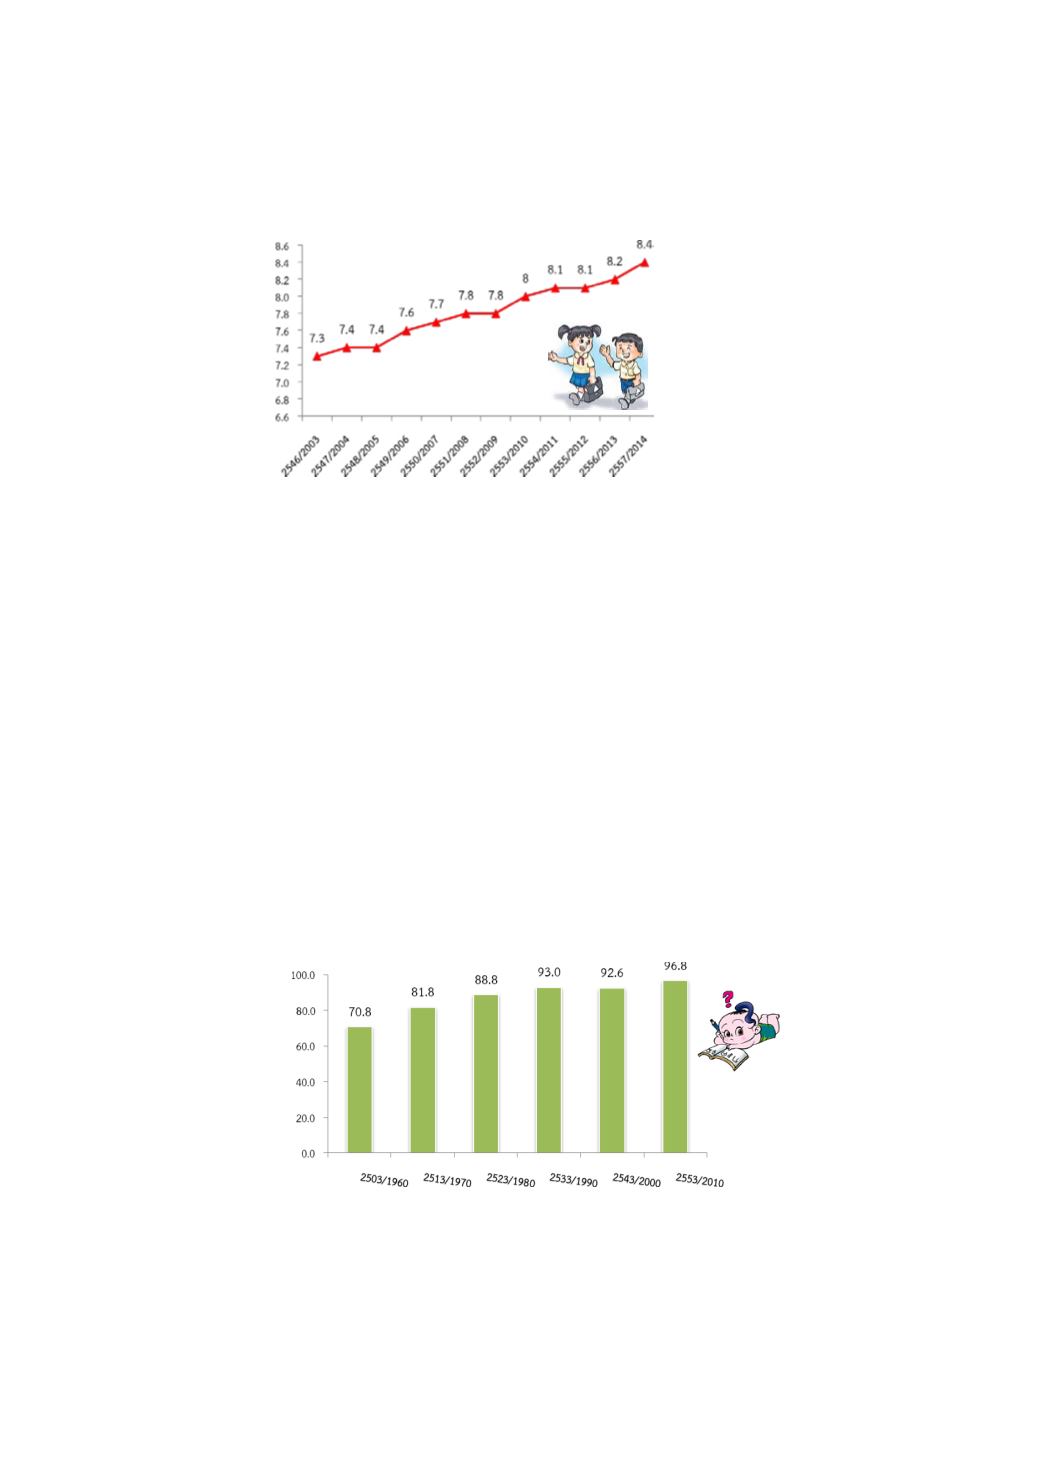
อั
ตราการอ
านออกเขี
ยนได
ของประชากร (อายุ
15 ป
ขึ
้
นไป) เพิ
่
มจากร
อยละ 70.8 ในป
2503 เป
นร
อยละ
96.8 คน ในป
2553
Ability to read and write a basic
sentence or a so-called the literacy rate is
one indicator, among others which reflects
the situation of education. From the result
of Population and Housing Census in 1960
to 2010 rounds showed that the literacy
rate has been increasing from 70.8% in
1960 to 96.8% in 2010.
แผนภู
มิ
3.1 จํ
านวนป
การศึ
กษาเฉลี่
ยของประชากรอายุ
15 ป
ขึ้
นไป พ.ศ. 2546-2557
Chart 3.1 The Average Years of Schooling of Population Aged 15 Years and Over: 2003-2014
ที่
มา:
ประมวลข
อมู
ลจากการสํ
ารวจภาวะการทํ
างานของประชากร ไตรมาส 3 กรกฏาคม-กั
นยายน พ.ศ. 2545-2557 สํ
านั
กงานสถิ
ติ
แห
งชาติ
Source :
Processed Data from The Labour Force Survey: Round 3 July-September 2002-2014, National Statistical Office.
จํ
านวนป
/Number of Years
ป
/Year
ร
อยละ/Percentage
แผนภู
มิ
3.2 การอ
านออกเขี
ยนได
พ.ศ. 2503-2553
Chart 3.2 Literacy of Population: 1960-2010
ที่
มา:
สํ
ามะโนประชากรและเคหะ พ.ศ. 2503-2553 สํ
านั
กงานสถิ
ติ
แห
งชาติ
Source: Population and Housing Census: 1960-2010, National Statistical Office.
ป
/Year


