32
2.2.3 การเลิ
กจ
าง
ข
อมู
ลการเลิ
กจ
างงาน และความต
องการ
แรง ง านของกรมการจั
ดหา งานนั
้
น สะท
อน
ภาพรวมเฉพาะแรงงานที
่
อยู
ในระบบประกั
นสั
งคม
ซึ
่
งจั
ดเก็
บข
อมู
ลเป
นรายเดื
อนเท
านั
้
น จากข
อมู
ล
ป
2556 และ 2557 พบว
า ผู
ขึ
้
นทะเบี
ยนขอรั
บ
ประโยชน
ทดแทน กรณี
ว
างงานมี
จํ
านวนลดลง
เมื
่
อเที
ยบในเดื
อนเดี
ยวกั
น โดยเหตุ
ผลเป
นการ
ลาออกเองมากกว
าเลิ
กจ
าง โดยเลิ
กจ
างเฉลี
่
ยทั
้
งป
มี
ประมาณ ร
อยละ 11.8
2.2.3 A Lay-off Statistics
A lay-off statistics presented in this
report was from Department of
Employment, which reflected only the
formal labour sector, on monthly basis. Data
from the records of claiming benefits
compensation of insured persons due to
unemployment in 2013 and 2014 showed
that number of unemployment decreased
compared to the same month. The reason
for a lay off, mostly the workers themselves
quitted the jobs more than a lay off reason.
The average annual proportion of a lay-off
was 11.8%.
อั
ตรา/Rate
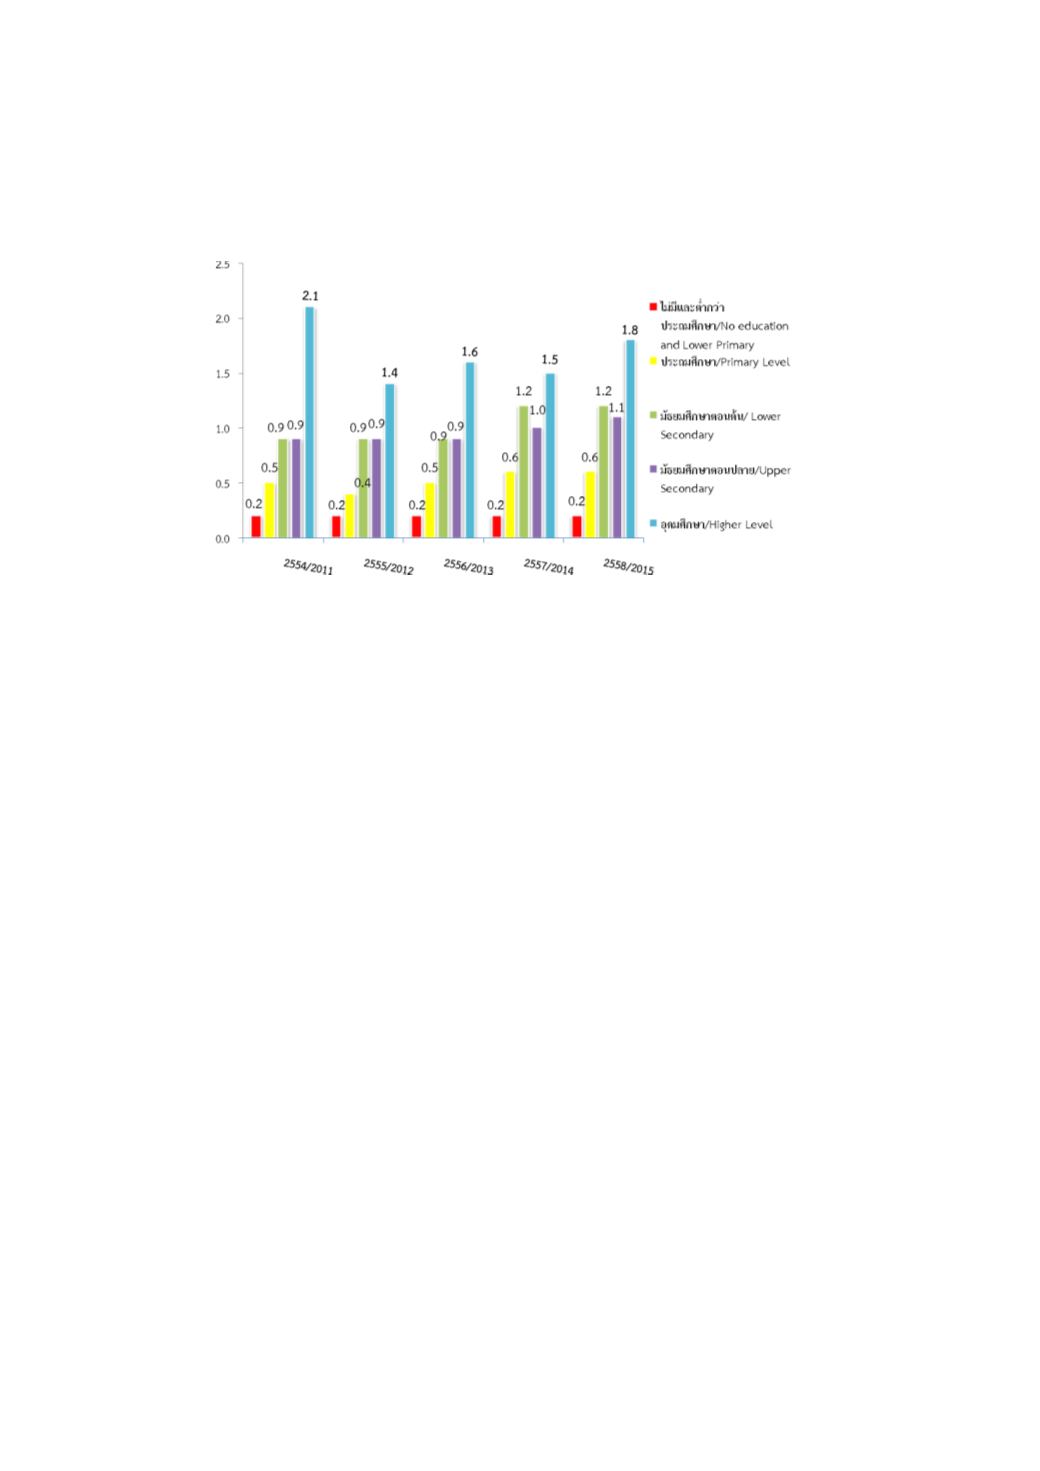
แผนภู
มิ
2.7 อั
ตราการว
างงาน จํ
าแนกตามระดั
บการศึ
กษาสู
งสุ
ด พ.ศ. 2554-2558
Chart 2.7 Unemployment Rate by Education Attainment: 2011-2015
ที่
มา:
การสํ
ารวจภาวะการทํ
างานของประชากร ไตรมาส 3 กรกฎาคม-กั
นยายน พ.ศ. 2554-2558 สํ
านั
กงานสถิ
ติ
แห
งชาติ
Source: The Labour Force Survey: Round 3 July-September 2011-2015, National Statistical Office.
ป
/Year


