11
นอกจำกข้
อมู
ลที่
แสดงให้
เห็
นถึ
งกำร
เพิ่
มขึ้
นของกำรรั
บภำระในกำรเลี้
ยงดู
ผู้
สู
งอำยุ
แล้
ว ยั
งมี
อี
กตั
วชี้
วั
ดหนึ่
งที่
แสดงให้
เห็
นถึ
งจำนวน
ประชำกรวั
ยแรงงำนที่
เกื้
อหนุ
นผู้
สู
งอำยุ
1 คน
คื
อ
“อั
ต ร า ศั
ก ย ภ า พ ส นั
บ ส นุ
น ผู้
สู
ง อ า ยุ
(Potential Support Ratio)
” ซึ่
ง ค ำ ด ว่
ำ
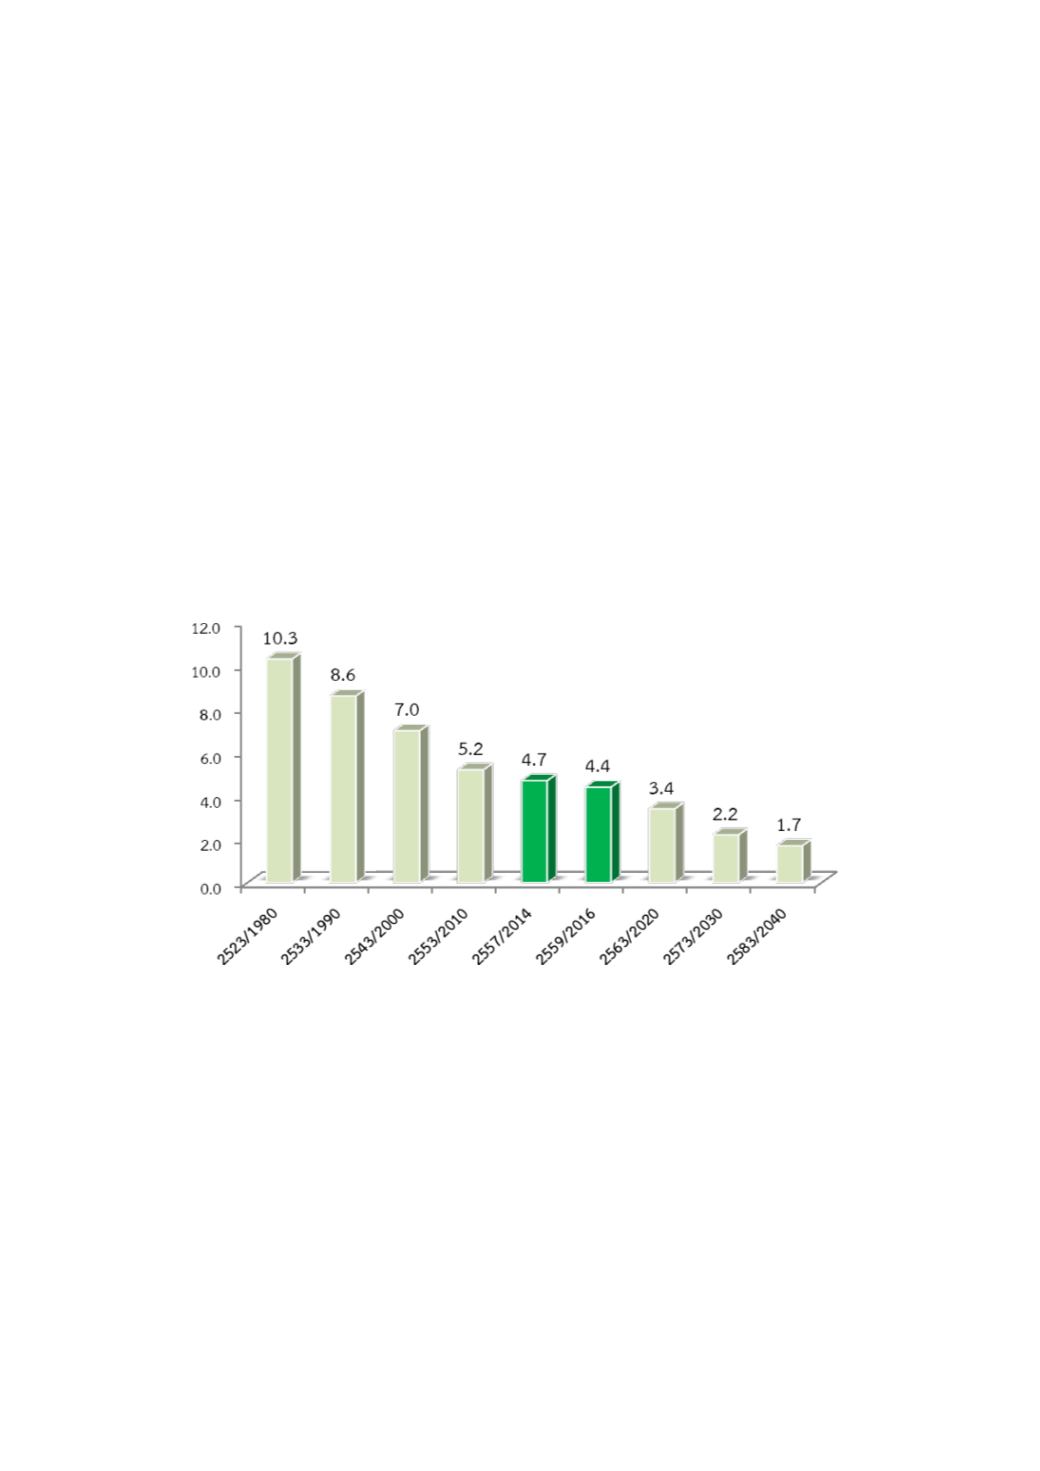
ในอนำคตจำนวนผู้
ที่
อยู่
ในวั
ยทำงำนที่
เกื้
อหนุ
น
ผู้
สู
งอำยุ
1 คน ลดน้
อยลงมำก จำก 4.4 คน ในปี
2559 เหลื
อเพี
ยง 1.7 คน ในอี
ก 20 ปี
ข้
ำงหน้
ำ
Potential Support Ratio which is,
another major indicator presenting the
measurement the ability of working aged
group in supporting 1 older person,
showed a decline from 4 . 4 persons in
2016 to 1 . 7 persons for the next 20
years.
ที่
มำ:
สำมะโนประชำกรและเคหะ พ.ศ. 2523-2553 สำนั
กงำนสถิ
ติ
แห่
งชำติ
ข้
อมู
ล พ.ศ. 2557, 2559 คำนวณโดยสำนั
กงำนสถิ
ติ
แห่
งชำติ
จำกข้
อมู
ลทะเบี
ยน กรมกำรปกครอง
กำรคำดประมำณประชำกรของประเทศไทย พ.ศ. 2553-2583 สำนั
กงำนคณะกรรมกำรพั
ฒนำกำรเศรษฐกิ
จและสั
งคมแห่
งชำติ
Source: Population and Housing Census: 1980-2010, National Statistical Office.
Data in 2014, 2016 was calculated by the National Statistical Office, using Data from Registration and Administration bases of
Department of Provincial Administration.
Population Projections for Thailand: 2010-2040, Office of the National Economic and Social Development Board.
อั
ตรา/Rate
ปี
/year
แผนภู
มิ
1. อั
ตราศั
กยภาพสนั
บสนุ
นผู้
สู
งอายุ
พ.ศ. 2523-2583
Chart 1. Potential Support Ratio: 1980-2040


