34
2.3 แรงงานนอกระบบ
แรงงำนของประเทศไทยส่
วนใหญ่
เป็
น
“แรงงำนนอกระบบ” ซึ่
งไม่
ได้
รั
บกำรคุ้
มครองและ
ไม่
ได้
รั
บสวั
สดิ
กำรใดๆ ทั้
งในด้
ำนสุ
ขภำพและ
ควำมมั่
นคงในชี
วิ
ตเหมื
อน “แรงงำนในระบบ”
ส่
งผลต่
อคุ
ณภำพชี
วิ
ตและประสิ
ทธิ
ภำพกำรทำงำน
ของแรงงำนกลุ่
มนี้
ในปี
2559 ผู้
ท ำงำนนอกระบบลดลง
จำกปี
2555 เกื
อบ ร้
อยละ 7 ซึ่
งผู้
ท ำงำน ใน
ภำคเกษตรกรรมอำจจะประสบปั
ญหำภั
ยแล้
ง จึ
ง
เข้
ำทำงำนในภำคอุ
ตสำหกรรมและกำรค้
ำและ
กำรบริ
กำรแทน โดยแรงงำนนอกระบบเหล่
ำนี้
ส่
วนใหญ่
มี
กำรศึ
กษำน้
อย และมำกกว่
ำครึ่
งทำงำนใน
ภำคเกษตรกรรม รองลงมำอยู่
ในภำคกำรค้
ำและ
กำรบริ
กำร และกำรผลิ
ต ตำมลำดั
บ
2.3 Informal Employment
Most of the labour force in
Thailand is informal sector which does
not have any protection and social
welfare in both health and life security
as the formal sector does.
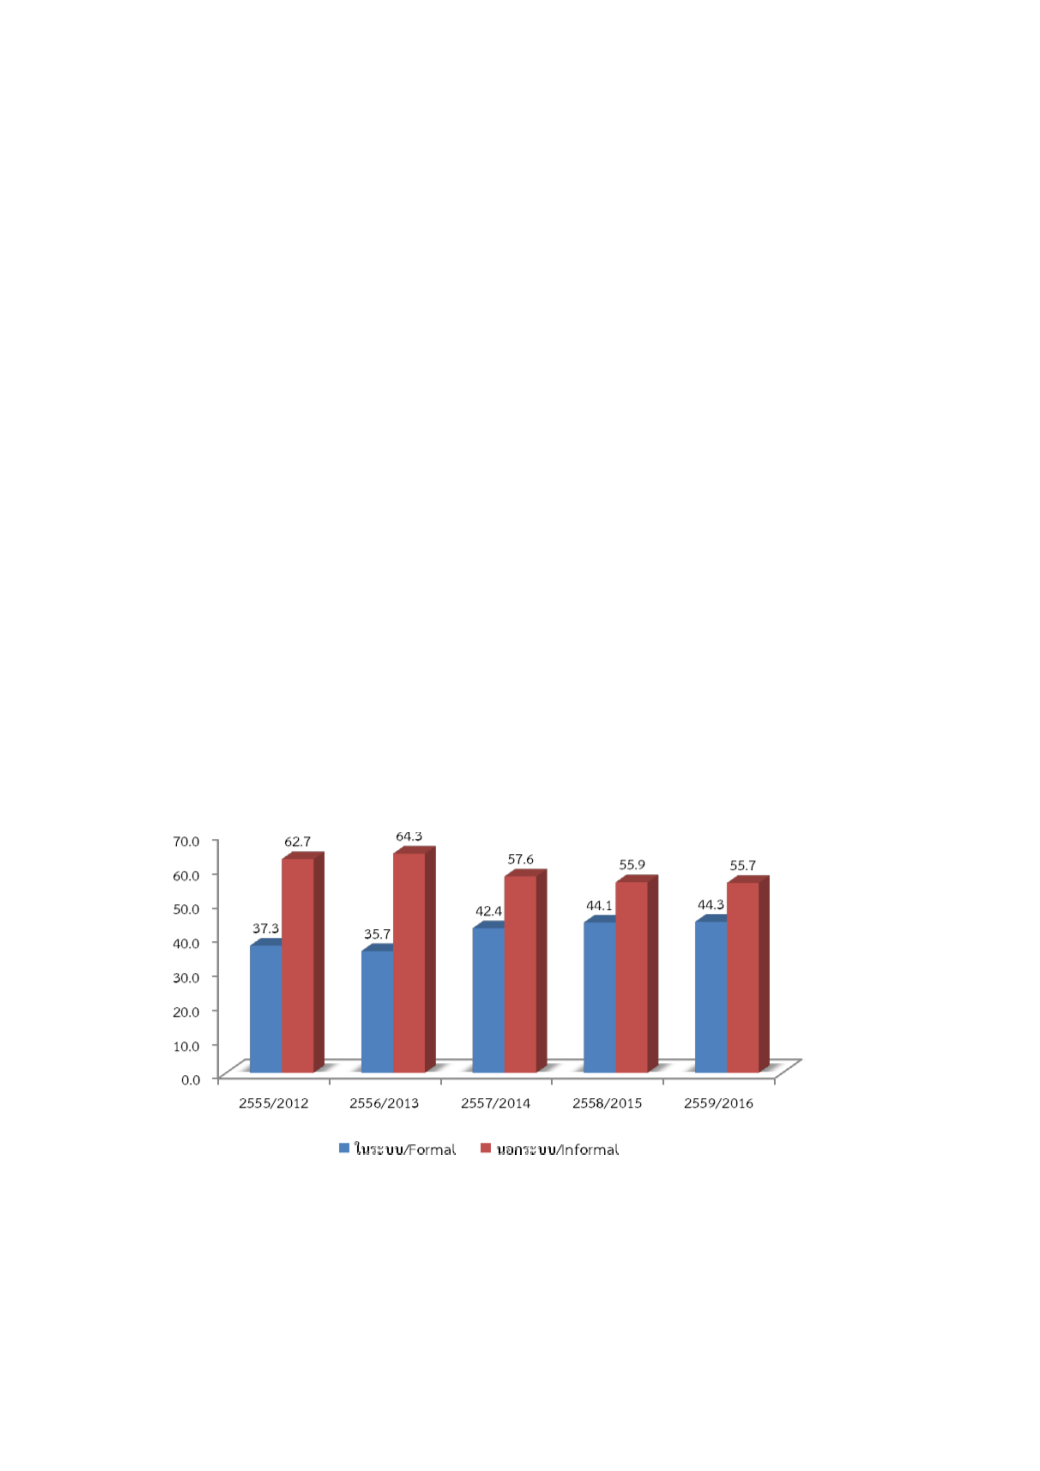
In 2016, the number of informal
workers decreased from 2012 about 7%.
Workers in agricultural sector encountered
with the drought so, they migrated to
work in industry, trade and service sectors
instead. Most of informal sector were low
educated; more than half were working in
agriculture sector followed by trade,
service and manufacturing sectors.
ร้
อยละ/Percentage
ปี
/Year
ที่
มำ: กำรสำรวจแรงงำนนอกระบบ พ.ศ. 2555-2559 สำนั
กงำนสถิ
ติ
แห่
งชำติ
Source:The Informal Employment Survey : 2012-2016 National Statistical Office.
แผนภู
มิ
2.7 ผู้
มี
งานทาในระบบและนอกระบบ พ.ศ. 2555-2559
Chart 2.7 Employed Persons in Formal and Informal Sectors: 2012-2016


