31
2.2.2 การว่
างงาน
กำรว่
ำงงำน หมำยถึ
ง ภำวะกำรณ์
ที่
บ ุ
ค ค ล ที
่
ม ี
อ ำ ย ุ
15 ป ี
ขึ
้
น ไป ซึ
่
ง ถ ื
อ ว ่
ำ อ ยู
่
ใน
วั
ยแรงงำน ไม่
ได้
ทำงำนหรื
อไม่
มี
งำนประจำ
ในรอบสั
ปดำห์
แต่
ได้
หำงำนหรื
อรอที
่
จะทำงำน
หรื
อผู้
ที่
ไม่
ได้
หำงำนทำแต่
พร้
อมจะทำงำน
จำกข้
อมู
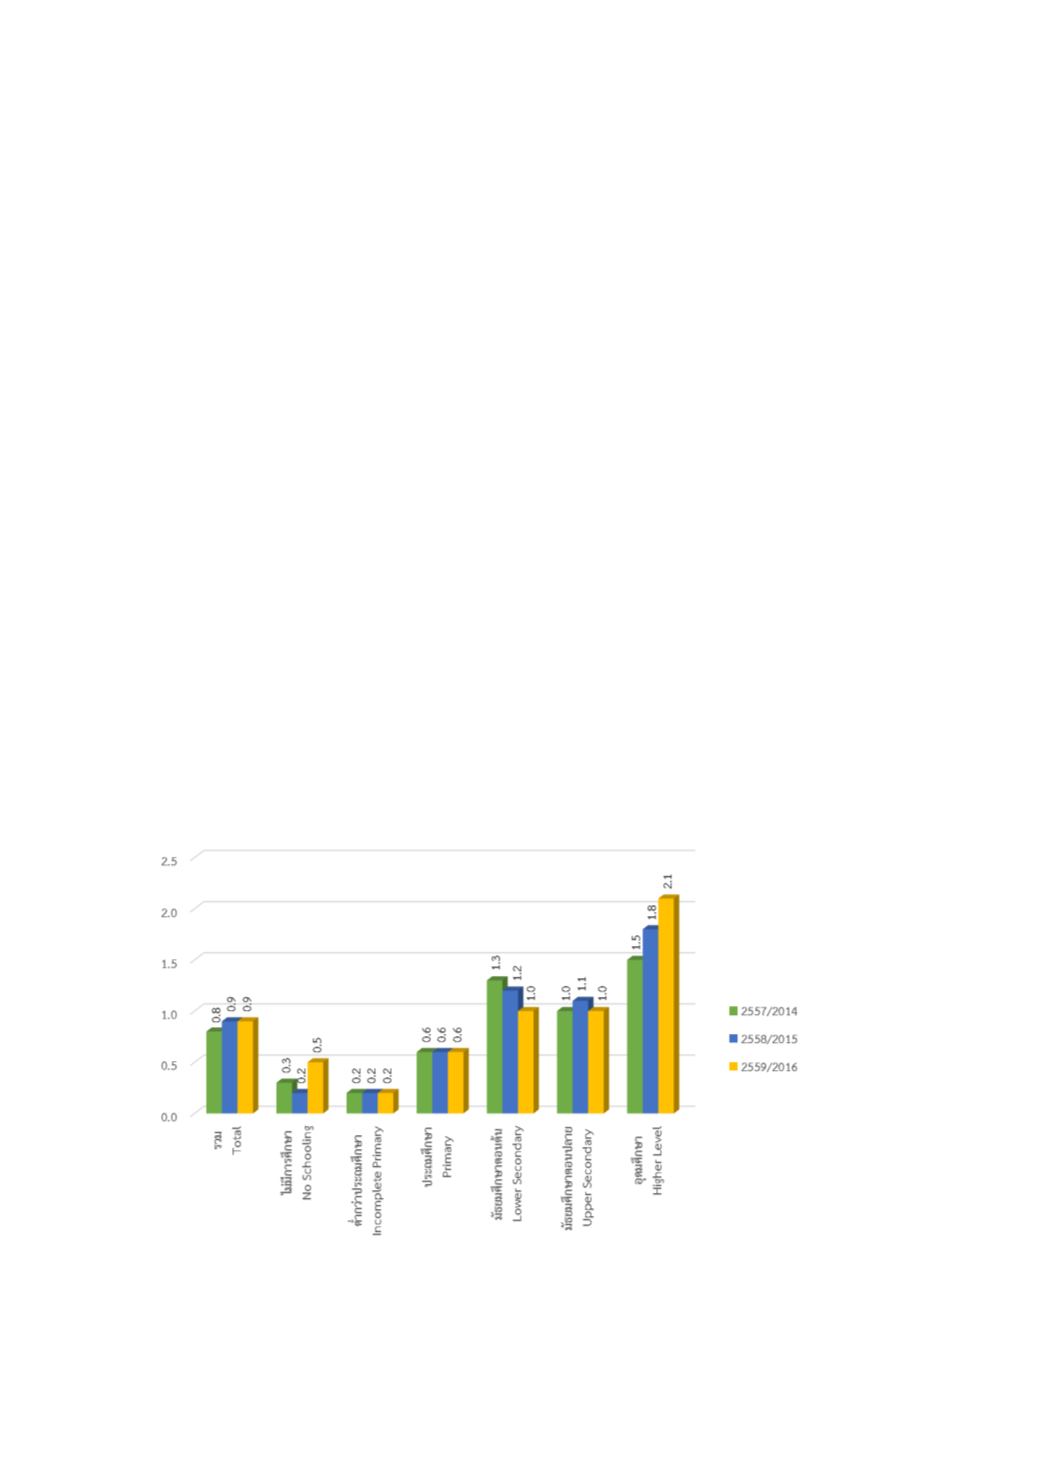
ลกำรสำรวจภำวะกำรทำงำนของ
ประชำกร ปี
2557-2559 ในช่
วงเวลำเดี
ยวกั
น
พบว่
ำ ระดั
บอุ
ดมศึ
กษำมี
อั
ตรำกำรว่
ำงงำนสู
งกว่
ำ
ระดั
บอื่
นๆ และมี
แนวโน้
มเพิ่
มขึ้
น ส่
วนหนึ่
งอำจมำ
จำกจบไม่
ตรงกั
บตลำดแรงงำนที่
ต้
องกำร หรื
อ
ควำมต้
องกำรเงิ
นเดื
อนที่
สู
งเกิ
นไป
2.2.2 Unemployment
Refers to the situation when the
persons with 15 years and over, who
neither worked nor had a job in the 7
days of an interview date but looked for a
job or not looking for a job but being
ready to work.
From the 2014-2016 Labour Force
Surveys, their results showed that
employed persons with higher education
were unemployed with higher rate than
other levels of education. Moreover, this
trend seems to increase, which might be
because their education qualifications did
not meet the Labour market’s demand or
they demanded too high rate of
compensation.
อั
ตรา/Rate
ที่
มำ: กำรสำรวจภำวะกำรทำงำนของประชำกร พ.ศ. 2557-2559 สำนั
กงำนสถิ
ติ
แห่
งชำติ
Source:The Labour Force Survey 2014-2016, National Statistical Office.
ระดั
บการศึ
กษา
Level of Educational Attainment
แผนภู
มิ
2.6 อั
ตราการว่
างงาน จาแนกตามระดั
บการศึ
กษา พ.ศ. 2557-2559
Chart 2.6 Unemployment Rate by Level of Educational Attainment: 2014-2016


